L2B vertical resampling/interpolation
Contents
L2B vertical resampling/interpolation
Vertical resampling and interpolation of the Aeolus scientific wind product (L2B)
Authors: Isabell Krisch
Abstract: Access to level 2B product, rearanging of the data into profiles, and interpolation to a regular altitude grid. The interpolation to a regular altitude grid takes about 5min for 3 variables and one week of Aeolus data.
Load packages, modules and extensions
# %load_ext blackcellmagic
# enable following line for interactive visualization backend for matplotlib
# %matplotlib widget
%load_ext watermark
%watermark -i -v -p viresclient,pandas,xarray,matplotlib
Python implementation: CPython
Python version       : 3.9.7
IPython version      : 8.0.1

viresclient: 0.11.0
pandas     : 1.4.1
xarray     : 0.21.1
matplotlib : 3.5.1
from viresclient import AeolusRequest
import numpy as np
import xarray as xr
import pandas as pd
import matplotlib.pyplot as plt
import matplotlib.dates as mdates
Load Aeolus data
For details on how to read Aeolus L2B data see Notebook Demo-ALD_U_N_2B.
This notbook only uses Rayleigh clear measurements. By adjusting the following section one could retrieve other data products and do the same e.g. also with Mie cloudy data.
# Aeolus product
DATA_PRODUCT = "ALD_U_N_2B"

# measurement period in yyyy-mm-ddTHH:MM:SS
measurement_start = "2019-09-11T22:00:00Z"
measurement_stop = "2019-09-12T00:00:00Z"

# define fields to retrieve
rayleigh_wind_fields = [
    "rayleigh_wind_result_start_time",
    "rayleigh_wind_result_stop_time",
    "rayleigh_wind_result_COG_altitude",
    "rayleigh_wind_result_wind_velocity",
    "rayleigh_wind_result_reference_hlos",
    "rayleigh_wind_result_HLOS_error",
    "rayleigh_wind_result_id",
    "rayleigh_wind_result_observation_type",
    "rayleigh_wind_result_validity_flag",
]

rayleigh_profile_fields = [
    "rayleigh_wind_profile_wind_result_id",
    "rayleigh_wind_profile_observation_type",
    "rayleigh_profile_datetime_average",
    "rayleigh_profile_alt_of_DEM_intersection",
    "rayleigh_profile_lat_of_DEM_intersection",
    "rayleigh_profile_lon_of_DEM_intersection",
]

# get L2B data
request = AeolusRequest()
request.set_collection(DATA_PRODUCT)
request.set_fields(
    rayleigh_wind_fields=rayleigh_wind_fields, rayleigh_profile_fields=rayleigh_profile_fields
)

L2B_rayleigh = request.get_between(
    start_time=measurement_start, end_time=measurement_stop, filetype="nc", asynchronous=True
).as_xarray()

# load data from dask array into storage. This line speeds up the code below a lot.
L2B_rayleigh = L2B_rayleigh.load()
Select only Rayleigh clear data
f_clear_p = L2B_rayleigh["rayleigh_wind_profile_observation_type"] == 2
f_clear = L2B_rayleigh["rayleigh_wind_result_observation_type"] == 2
L2B_rayleigh_clear = L2B_rayleigh.isel(rayleigh_profile_data=f_clear_p, rayleigh_wind_data=f_clear)
Reshape the data into 2D arrays (profile vs. range bin)
def reshape_to_profile(data, mtype="rayleigh"):
    """
    Input:   data      xarray.Dataset containing Aeolus L2B wind data.
                       It needs to contain the parameters wind_result_id and wind_profile_wind_result_id
             mtype     Measurement type (Rayleigh or Mie)

    Output:  data_2D   xarray.Dataset containing all variables from data resampled into 2D (profile vs. range-bin)
    """
    # get data shape of (new) 2D array
    data_shape = data[mtype + "_wind_profile_wind_result_id"].shape
    # get wind ids from 1D dataset
    wind_result_id = data[mtype + "_wind_result_id"].astype(np.int32)
    # get wind ids per profile and reshape to 1D
    new_wind_result_id = data[mtype + "_wind_profile_wind_result_id"].values.flatten()
    mask = new_wind_result_id == 0

    # increment all ambigious wind ids (necessary if multiple L2B files were concatenated by the request)
    while (np.diff(wind_result_id) < 0).sum() > 0:
        i = np.where(np.diff(wind_result_id) < 0)[0][0]
        increment = -np.diff(wind_result_id)[i] + 1
        ip = np.where(new_wind_result_id == wind_result_id[i].values)[0][0]
        wind_result_id[i + 1 :] += increment
        new_wind_result_id[ip + 1 :] += increment
    new_wind_result_id[mask] = 0

    # populate wind ids with incremented values and reindex all 1D DataArrays to 2D (still on 1D)
    data[mtype + "_wind_result_id"] = wind_result_id
    data_1D = (
        data.drop_dims(mtype + "_profile_data")
        .set_index({mtype + "_wind_data": "rayleigh_wind_result_id"})
        .reindex({mtype + "_wind_data": new_wind_result_id})
    )

    # reshape to 2D and reinclude all original 2D DataArrays
    midx = pd.MultiIndex.from_product(
        [range(1, data_shape[0] + 1), range(1, data_shape[1] + 1)],
        names=("rayleigh_profile_data", "array_24"),
    )
    data_1D[mtype + "_wind_data"] = midx
    data_2D = xr.merge(
        [data.drop_dims(mtype + "_wind_data"), data_1D.unstack(dim=mtype + "_wind_data")]
    )
    return data_2D
%%time
L2B_rayleigh_clear_2D = reshape_to_profile(L2B_rayleigh_clear, mtype="rayleigh")

# discard all duplicate profiles (duplicates may occure in neighbouring orbits due to downlinking procedure)
_, profile_index = np.unique(
    L2B_rayleigh_clear_2D["rayleigh_profile_datetime_average"], return_index=True
)
L2B_rayleigh_clear_2D = L2B_rayleigh_clear_2D.isel(rayleigh_profile_data=profile_index)
CPU times: user 6.98 ms, sys: 3.69 ms, total: 10.7 ms
Wall time: 10.4 ms
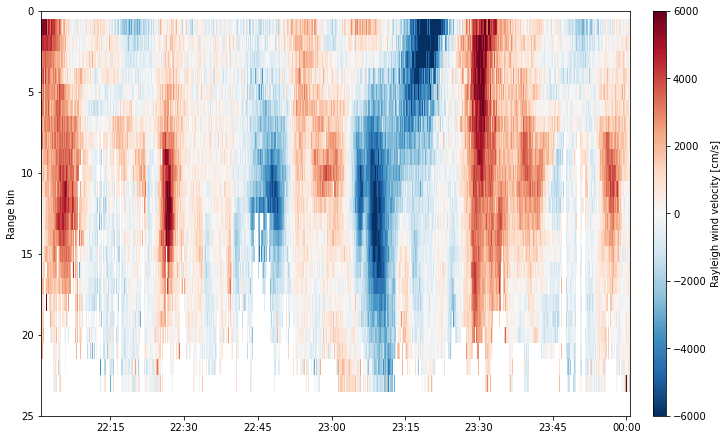
# plot curtain of 2D data
plot_data = xr.decode_cf(L2B_rayleigh_clear_2D, decode_times=True)
ee_QC_filter = plot_data["rayleigh_wind_result_HLOS_error"] < 800
fig, ax = plt.subplots(1, 1, figsize=(10, 6), constrained_layout=True)
p = ax.pcolormesh(
    plot_data["rayleigh_profile_datetime_average"],
    plot_data["array_24"],
    plot_data["rayleigh_wind_result_wind_velocity"].where(ee_QC_filter).T,
    shading="auto",
    vmin=-6000,
    vmax=6000,
    cmap="RdBu_r",
)
ax.xaxis.set_major_formatter(mdates.DateFormatter("%H:%M"))
ax.autoscale()
units = plot_data["rayleigh_wind_result_wind_velocity"].units
fig.colorbar(p, ax=ax, aspect=30, pad=0.02, label="Rayleigh wind velocity [{:s}]".format(units))
ax.set_ylabel("Range bin")
ax.set_ylim(25, 0)
(25.0, 0.0)
Interpolate Aeolus data to a regular altitude grid
def interpolate_to_altitude(
    data,
    altitudes=np.arange(0, 30000, 1000),
    mtype="rayleigh",
    variables=["rayleigh_wind_result_wind_velocity"],
    altitude_name="rayleigh_wind_result_COG_altitude",
):
    """
    Input:   data           xarray.Dataset containing Aeolus L2B wind data on a 2D array
                            (profile vs range-bin).
             altitude       numpy.Array containing the new altitude grid (in meter)
             mtype          Measurement type (Rayleigh or Mie)
             variables      List or None: Names of variables to interpolate to the new grid. None will interpolate all variables.
             altitude_name  Name of altitude variable in input dataset (used for interpolation)

    Output:  data_alt   xarray.Dataset containing all variables from data resampled into 2D (profile vs. range-bin)
    """
    # create a xarray.DataArray with given altitudes
    new_alts = xr.DataArray(
        data=altitudes, name=mtype + "_altitude", dims=[mtype + "_altitude"], attrs={"units": "m"}
    )

    # remove unecessary variables before interpolation
    if variables is not None:
        # save all 1D variables for later
        data_1D = data.drop_dims("array_24")
        # remove all unnecessary variables for processing
        variables.append(altitude_name)
        dims = list(data.dims)
        for var in list(data.variables):
            if var not in (dims + variables):
                data = data.drop_vars(var)

    # fill the new DataSet with all reinterpolated variables variables
    results = []
    for t_label, t_group in data.groupby(mtype + "_profile_data"):
        results.append(t_group.squeeze().dropna(dim="array_24").set_index({"array_24": altitude_name}).interp(array_24=new_alts))
    data_alt = xr.concat(results, dim=mtype + "_profile_data_bins")
    data_alt = data_alt.rename({mtype + "_profile_data_bins": mtype + "_profile_data", "array_24": mtype + "_altitude"})

    # re-add 1D variables to DataSet (if they have been removed before)
    if variables is not None:
        data_alt = xr.merge([data_alt, data_1D])

    return data_alt
%%time
L2B_rayleigh_clear_2D_reg_alt = interpolate_to_altitude(
    L2B_rayleigh_clear_2D,
    altitudes=np.arange(0, 30000, 1000),
    mtype="rayleigh",
    variables=[
        "rayleigh_wind_result_wind_velocity",
        "rayleigh_wind_result_reference_hlos",
        "rayleigh_wind_result_HLOS_error",
    ],
    altitude_name="rayleigh_wind_result_COG_altitude",
)
CPU times: user 1.61 s, sys: 6.18 ms, total: 1.62 s
Wall time: 1.62 s
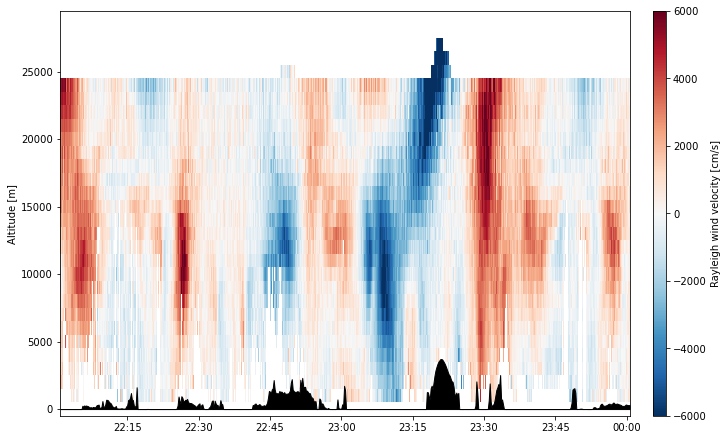
# plot curtain of 2D data on regular altitude grid
plot_data = xr.decode_cf(L2B_rayleigh_clear_2D_reg_alt, decode_times=True)
ee_QC_filter = plot_data["rayleigh_wind_result_HLOS_error"] < 800
fig, ax = plt.subplots(1, 1, figsize=(10, 6), constrained_layout=True)
p = ax.pcolormesh(
    plot_data["rayleigh_profile_datetime_average"],
    plot_data["rayleigh_altitude"],
    plot_data["rayleigh_wind_result_wind_velocity"].where(ee_QC_filter).T,
    shading="auto",
    vmin=-6000,
    vmax=6000,
    cmap="RdBu_r",
)
ax.fill_between(
    plot_data["rayleigh_profile_datetime_average"],
    plot_data["rayleigh_profile_alt_of_DEM_intersection"],
    color="k",
)
ax.xaxis.set_major_formatter(mdates.DateFormatter("%H:%M"))
ax.autoscale()
units = plot_data["rayleigh_wind_result_wind_velocity"].units
fig.colorbar(p, ax=ax, aspect=30, pad=0.02, label="Rayleigh wind velocity [{:s}]".format(units))
alt_units = plot_data["rayleigh_altitude"].units
ax.set_ylabel("Altitude [{:s}]".format(alt_units))
Text(0, 0.5, 'Altitude [m]')