Aeolus Level 1A product
Contents
from viresclient import AeolusRequest
import matplotlib.pyplot as plt
import matplotlib.dates as mdates
from netCDF4 import Dataset
import pandas as pd
from netCDF4 import num2date
Aeolus Level 1A product
Unprocessed Aeolus measurement data
Abstract: Access to level 1A product and its visualization
Product information
The Level 1A product of the Aeolus mission contains time-ordered unprocessed detector counts from the atmospheric and internal instrument paths as well as housekeeping information.
Important: Access to L1A dataset needs to be requested and is not provided as default. Please contact ESA’s EO Help desk if you would like to get access to this product.
L1A parameters on VirES
We can print the available parameters for a collection using the print_available_collections method.
request = AeolusRequest()
request.print_available_collections(collection="ALD_U_N_1A")
| uom | description | ||
|---|---|---|---|
| field type | identifier | ||
| observation_fields | time | seconds since 2000-01-01 | UTC Time at center of obs/meas. |
| mie_longitude | degrees_east | Longitude of each Mie height bin along the line-of-sight | |
| mie_latitude | degrees_north | Latitude of each Mie height bin along the line-of-sight | |
| mie_altitude | m | Altitude of Mie height bins with respect to the WGS84 ellipsoid along the line-of-sight | |
| mie_topocentric_azimuth_of_height_bin | degrees | Azimuth of target-to-satellite topocentric pointing vector of the height bin | |
| mie_topocentric_elevation_of_height_bin | degrees | Elevation of target-to-satellite topocentric pointing vector of the height bin | |
| mie_target_to_sun_visibility_flag | - | ||
| mie_range | m | Distance along the LOS between the instrument and the lower edge of the Mie height bin | |
| rayleigh_longitude | degrees_east | Longitude of each Rayleigh height bin along the line-of-sight | |
| rayleigh_latitude | degrees_north | Latitude of each Rayleigh height bin along the line-of-sight | |
| rayleigh_altitude | m | Altitude of Rayleigh height bins with respect to the WGS84 ellipsoid along the line-of-sight | |
| rayleigh_topocentric_azimuth_of_height_bin | degrees | Azimuth of target-to-satellite topocentric (horizontal reference frame) pointing vector of the height bin | |
| rayleigh_topocentric_elevation_of_height_bin | degrees | Elevation of target-to-satellite topocentric (horizontal reference frame) pointing vector of the height bin | |
| rayleigh_target_to_sun_visibility_flag | - | Sun visibility flag. Value set to -1 if sun eclipsed by earth; value set to +1 if sun (center) visible | |
| rayleigh_range | m | Distance along the LOS between the instrument and the lower edge of the Rayleigh height bin | |
| latitude_of_DEM_intersection | degrees_north | Latitude of the intersection of DEM and the line-of-sight | |
| longitude_of_DEM_intersection | degrees_east | Longitude of the intersection of DEM and the line-of-sight | |
| altitude_of_DEM_intersection | m | Altitude of the intersection of DEM and the line-of-sight | |
| argument_of_latitude_of_dem_intersection | degrees_north | Argument of latitude of DEM intersection | |
| sun_elevation_angle | deg | Sun elevation angle at DEM intersection | |
| velocity_at_DEM_intersection | m/s | Velocity along the line of sight at the DEM | |
| geoid_separation | m | Height of geoid above WGS84 ellipsoid | |
| AOCS_x_position | m | X position in Earth-fixed reference | |
| AOCS_y_position | m | Y position in Earth-fixed reference | |
| AOCS_z_position | m | Z position in Earth-fixed reference | |
| AOCS_x_velocity | m/s | X velocity in Earth-fixed reference | |
| AOCS_y_velocity | m/s | Y velocity in Earth-fixed reference | |
| AOCS_z_velocity | m/s | Z velocity in Earth-fixed reference | |
| AOCS_roll_angle | degrees | Roll angle in satellite reference for each observation | |
| AOCS_pitch_angle | degrees | Pitch angle in satellite reference for each observation | |
| AOCS_yaw_angle | degrees | Yaw angle in satellite reference for each observation | |
| num_reference_pulses | - | Number of reference pulses | |
| mie_reference_pulse | - | Contains pixel values. The first 2 values are the pre-pixel of the ACCD. The last two are used to correct the offset. | |
| rayleigh_reference_pulse | - | Contains pixel values. The first 2 values are the pre-pixel of the ACCD. The last two are used to correct the offset | |
| instrument_mode | - | Instrument mode. Laser burst warm up, calibration slow, calibration fast 1, calibration fast 2 | |
| number_of_pulses_per_meas | - | Number of pulses per measurement | |
| number_of_meas_per_obs | - | Number of measurements per BRC | |
| average_laser_frequency_offset | GHz | Average laser frequency offset | |
| average_laser_energy | mJ | Average laser pulse UV energy of N * (P - 1) pulses, regardless of the UV_Energy_OK_Status | |
| laser_frequency_offset_std_dev | GHz | Laser frequency offset standard deviation | |
| uv_energy_std_dev | mJ | Laser pulse UV energy standard deviation | |
| dt1 | - | dt1 pulse delay constant for BRC | |
| dt2 | - | dt2 pulse delay constant for BRC | |
| dt3_fixed | - | Fixed dt3 pulse delay constant for BRC | |
| dt4 | - | dt4 pulse delay constant for BRC | |
| dt5 | - | dt5 pulse delay constant for BRC | |
| deu_imaging_integration_time | - | DEU Imaging Integration Time for the IDC mode | |
| td_ray_mie | - | Td_ray_mie | |
| mie_bin_integration_time | - | Individual time delay for each layer (bin) | |
| mie_bkg_integration_time | - | Duration of background integration time | |
| ray_bin_integration_time | - | Individual time delay for each layer (bin) | |
| ray_bkg_integration_time | - | Duration of background integration time | |
| mie_accd_temp | degC | Average of 10 Mie ACCD die temperatures | |
| ray_accd_temp | degC | Average of 10 Rayleigh ACCD die temoeratures | |
| deu_temp | degC | Average of DEU temperature | |
| m1_temp | degC | Average of Aht 22, Aht 23, Aht 24, Aht 25, Aht 26 and Aht 27 M1 temperatures | |
| aht_22_tel_m1 | degC | Average of Aht 22 M1 temperatures | |
| aht_23_tel_m1 | degC | Average of Aht 23 M1 temperatures | |
| aht_24_tel_m1 | degC | Average of Aht 24 M1 temperatures | |
| aht_25_tel_m1 | degC | Average of Aht 25 M1 temperatures | |
| aht_26_tel_m4 | degC | Average of Aht 26 M1 temperatures | |
| aht_27_tel_m5 | degC | Average of Aht 27 M1 temperatures | |
| m1_tc_temp | degC | Average of TC 18, TC 19, TC 20, and TC 21 M1 TC temperatures | |
| tc_18_tel_m11 | degC | Average of TC 18 Tel M1-1 temperatures | |
| tc_19_tel_m12 | degC | Average of TC 19 Tel M1-2 temperatures | |
| tc_20_tel_m13 | degC | Average of TC 20 Tel M1-3 temperatures | |
| tc_21_tel_m14 | degC | Average of TC 21 Tel M1-4 temperatures | |
| tc_25_tm15_ths1y | degC | Average of TC 25 TM15 Ths1-Y temperatures | |
| tc_27_tm16_ths1y | degC | Average of TC 27 TM16 Ths1-Y temperatures | |
| tc_29_ths2 | degC | Average of TC 29 Ths2 temperatures | |
| tc_23_ths1 | degC | Average of TC 23 Ths1 temperatures | |
| tc_32_ths3 | degC | Average of TC 32 Ths3 temperatures | |
| struts_temp_pxpy | degC | Average of Struts temperature +X+Y | |
| struts_temp_mxpy | degC | Average of Struts temperature -X+Y | |
| struts_temp_mpy | degC | Average of Struts temperature -Y | |
| m2_tc_temp | degC | Average of M2 TC temperature | |
| mie_measurement_data | - | Mie measurement data, restructured to be as obs, meas, layer, pixel | |
| rayleigh_measurement_data | - | Rayleigh measurement data, restructured to be as obs, meas, layer, pixel | |
| measurement_fields | time | seconds since 2000-01-01 | UTC Time at center of obs/meas. |
| AOCS_x_position | m | X position in Earth-fixed reference | |
| AOCS_y_position | m | Y position in Earth-fixed reference | |
| AOCS_z_position | m | Z position in Earth-fixed reference | |
| AOCS_x_velocity | m/s | X velocity in Earth-fixed reference | |
| AOCS_y_velocity | m/s | Y velocity in Earth-fixed reference | |
| AOCS_z_velocity | m/s | Z velocity in Earth-fixed reference | |
| AOCS_roll_angle | degrees | Roll angle in satellite reference for each measurement | |
| AOCS_pitch_angle | degrees | Pitch angle in satellite reference for each measurement | |
| AOCS_yaw_angle | degrees | Yaw angle in satellite reference for each measurement | |
| mie_longitude | degrees_east | Longitude of each Mie height bin along the line-of-sight | |
| mie_latitude | degrees_north | Latitude of each Mie height bin along the line-of-sight | |
| mie_altitude | m | Altitude of Mie height bins with respect to the WGS84 ellipsoid along the line-of-sight | |
| mie_range | m | Distance along the LOS between the instrument and the lower edge of the Mie height bin | |
| rayleigh_longitude | degrees_east | Longitude of each Rayleigh height bin along the line-of-sight | |
| rayleigh_latitude | degrees_north | Latitude of each Rayleigh height bin along the line-of-sight | |
| rayleigh_altitude | m | Altitude of Rayleigh height bins with respect to the WGS84 ellipsoid along the line-of-sight | |
| rayleigh_range | m | Distance along the LOS between the instrument and the lower edge of the Rayleigh height bin | |
| latitude_of_DEM_intersection | degrees_north | Latitude of the intersection of DEM and the line-of-sight | |
| longitude_of_DEM_intersection | degrees_east | Longitude of the intersection of DEM and the line-of-sight | |
| altitude_of_DEM_intersection | m | Altitude of the intersection of DEM and the line-of-sight | |
| argument_of_latitude_of_dem_intersection | degrees_north | Argument of latitude of DEM intersection | |
| sun_elevation_angle | deg | Sun elevation angle at DEM intersection | |
| velocity_at_DEM_intersection | m/s | Velocity along the line of sight at the DEM |
Defining product, parameters and time for the data request
Keep in mind that the time for one full orbit is around 90 minutes. The repeat cycle of the orbits is 7 days.
# Aeolus product
DATA_PRODUCT = "ALD_U_N_1A"

# measurement period in yyyy-mm-ddTHH:MM:SS
measurement_start="2022-08-03T00:00:58Z"
measurement_stop="2022-08-03T01:50:34Z"

# Product parameters to retrieve
# uncomment parameters of interest

# Mie observation level
parameter_mie_observations = [
    "reference_pulse",
    "measurement_data",
    "longitude",
    "latitude",
]

parameter_mie_observations = ["mie_" + param for param in parameter_mie_observations]

# Rayleigh observation level
parameter_rayleigh_observations = [
    "reference_pulse",
    "measurement_data",
    "longitude",
    "latitude"
]

parameter_rayleigh_observations = ["rayleigh_" + param for param in parameter_rayleigh_observations]


parameter_observations_indepdendent = ["time", "num_reference_pulses"]

parameter_list_observations = (
    parameter_rayleigh_observations
    + parameter_mie_observations
    + parameter_observations_indepdendent
)
Retrieve data from VRE server
# Data request for observation level
# check if observation parameter list is not empty
if len(parameter_list_observations) > 0:

    request = AeolusRequest()

    request.set_collection(DATA_PRODUCT)

    # set observation fields
    request.set_fields(
        observation_fields=parameter_list_observations,
    )

    # set start and end time and request data
    data_response = request.get_between(
        start_time=measurement_start, end_time=measurement_stop, filetype="nc", asynchronous=False

    )
ds_observations = data_response.as_xarray()
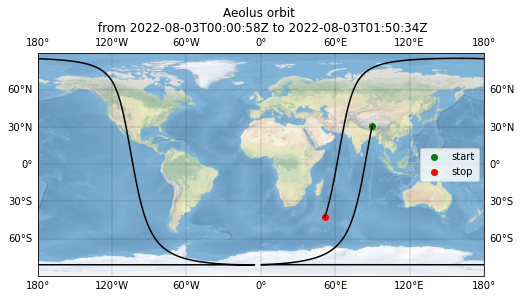
Plot data on map
import cartopy.crs as ccrs

fig = plt.figure(figsize=(8, 6))
ax = fig.add_subplot(1, 1, 1, projection=ccrs.PlateCarree())
ax.stock_img()
gl = ax.gridlines(draw_labels=True, linewidth=0.3, color="black", alpha=0.5, linestyle="-")
ax.plot(
    ds_observations["rayleigh_longitude"][:, -1],
    ds_observations["rayleigh_latitude"][:, -1],
    "k-",
    transform=ccrs.PlateCarree(),
)
ax.scatter(
    ds_observations["rayleigh_longitude"][0, -1],
    ds_observations["rayleigh_latitude"][0, -1],
    marker="o",
    c="g",
    edgecolor="g",
    label="start",
    transform=ccrs.PlateCarree(),
)
ax.scatter(
    ds_observations["rayleigh_longitude"][-1, -1],
    ds_observations["rayleigh_latitude"][-1, -1],
    marker="o",
    c="r",
    edgecolor="r",
    label="stop",
    transform=ccrs.PlateCarree(),
)
ax.legend()
ax.set_title("Aeolus orbit \n from {} to {}".format(measurement_start, measurement_stop))
Text(0.5, 1.0, 'Aeolus orbit \n from 2022-08-03T00:00:58Z to 2022-08-03T01:50:34Z')
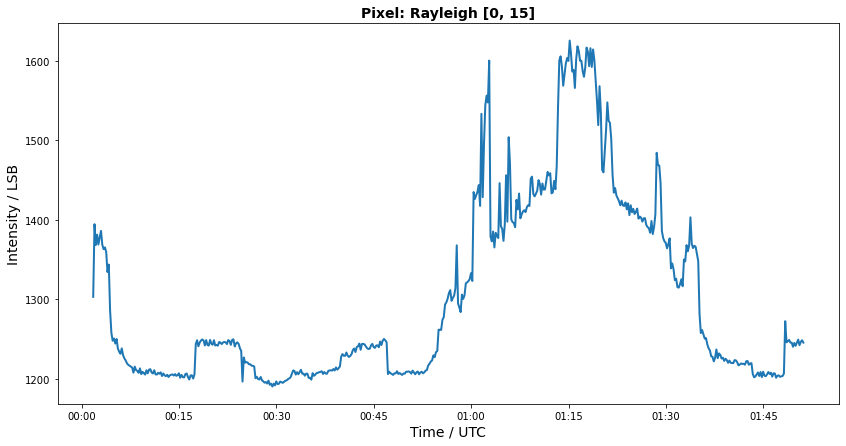
Plot ACCD counts at pixel level
The following example allows to visualize the raw ACCD counts of the atmospheric path for selected pixels. The data is averaged over the measurements of the observations.
# select channel and pixel coordinate (counting starts at zero)

channel = 'rayleigh'
pixel = [0, 15]

if not channel in ('mie', 'rayleigh'):
    raise Exception('Invalid channel selection. Allowed values are "mie" or "rayleigh"')

if not 0 <= pixel[0] <= 24:
    raise Exception('Invalid pixel selection. Allowed range for the pixel row is from 0 to 24.')

if not 0 <= pixel[1] <= 15:
    raise Exception('Invalid pixel selection. Allowed range for the pixel column is from 0 to 15.')


# extract data
pixel_data = ds_observations[channel + '_measurement_data'][:, :, pixel[0], pixel[1]].data.mean(axis=1)
time = num2date(
    ds_observations["time"], units="s since 2000-01-01", only_use_cftime_datetimes=False
)
fig = plt.figure(figsize=(14, 7))
ax = plt.subplot()
ax.plot(time, pixel_data, linewidth=2.0)
ax.set_title('Pixel: ' + channel.capitalize() + ' ' + str(pixel), fontsize=14, fontweight='bold')
ax.set_xlabel('Time / UTC', fontsize=14)
ax.set_ylabel('Intensity / LSB', fontsize=14)
ax.xaxis.set_major_formatter(mdates.DateFormatter("%H:%M"))
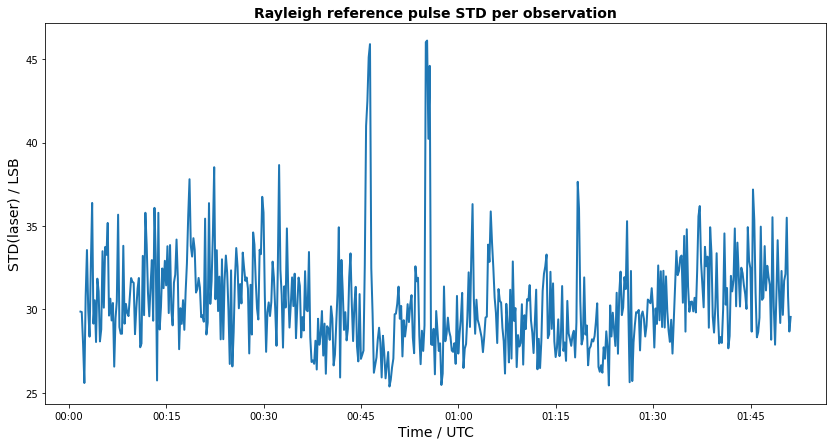
Visualize reference pulse data
The following example demonstrates how to analyse reference pulse data by visualizing the standard deviation of the sunmmed up reference signal counts per observation.
# select channel
channel = 'rayleigh'

if not channel in ('mie', 'rayleigh'):
    raise Exception('Invalid channel selection. Allowed values are "mie" or "rayleigh"')


# extract data
num_ref_pulse = ds_observations["num_reference_pulses"][:].data[0]
ref_pulse_std = ds_observations[channel + '_reference_pulse'][:, :num_ref_pulse, 2:18].data.sum(axis=2).std(axis=1)
fig = plt.figure(figsize=(14, 7))
ax = plt.subplot()
ax.plot(time, ref_pulse_std, linewidth=2.0)
ax.set_title(channel.capitalize() + ' reference pulse STD per observation', fontsize=14, fontweight='bold')
ax.set_xlabel('Time / UTC', fontsize=14)
ax.set_ylabel('STD(laser) / LSB', fontsize=14)
ax.xaxis.set_major_formatter(mdates.DateFormatter("%H:%M"))