Aeolus Level 2B product
Contents
Aeolus Level 2B product
Aeolus scientific wind product
Abstract: Access to level 2B product and its visualization
Load packages, modules and extensions
# enable following line for interactive visualization backend for matplotlib
# %matplotlib widget
# print version info
%load_ext watermark
%watermark -i -v -p viresclient,pandas,xarray,matplotlib
Python implementation: CPython
Python version       : 3.9.7
IPython version      : 8.0.1

viresclient: 0.11.0
pandas     : 1.4.1
xarray     : 0.21.1
matplotlib : 3.5.1
from viresclient import AeolusRequest
import numpy as np
from netCDF4 import num2date
import matplotlib.pyplot as plt
from matplotlib.collections import PolyCollection
import matplotlib.cm as cm
import matplotlib.colors as colors
import cartopy.crs as ccrs
Product information
The Level 2B wind product of the Aeolus mission is a geo-located, fully consolidated HLOS (horizontal line-of-sight) wind observation. Corrections of Rayleigh winds for the influence of atmospheric temperature and pressure broadening effects as well as corrections for systematic error sources are applied.
Documentation: -https://earth.esa.int/eogateway/catalog/aeolus-scientific-l2b-rayleigh-mie-wind-product
L2B parameters on VirES
Many of the parameters of the L2B product can be obtained via the viresclient. A list of selected parameters can be found in the following table. For a complete list, please refer to the web client which lists the available parameters under the “Data” tab. For an explanation of the parameters, please refer to the VirES web client or the documentation (link above).
The parameters are available specifically for Rayleigh or Mie measurements and are then divided into Rayleigh-clear, Mie-cloudy, Rayleigh-cloudy and Mie-clear, the first two being the most reliable with the smallest errors according to their physical principle.
In contrast to the L1B-product, where whole measurement profiles are available, the L2B-product can be considered as point measurements where several profiles are averaged range bin-wise to obtain a “group”. For each group, start and stop time as well as bottom and top altitude is avaiable as different parameters.
A description of the parameters in the table is shown as tooltip when hovering the parameter name.
Parameter |
Rayleigh channel |
Mie channel |
Unit |
|---|---|---|---|
x |
x |
||
x |
x |
||
x |
x |
||
x |
x |
m |
|
x |
x |
m |
|
x |
x |
m |
|
x |
x |
||
x |
x |
||
x |
x |
DegN |
|
x |
x |
DegN |
|
x |
x |
DegN |
|
x |
x |
DegE |
|
x |
x |
DegE |
|
x |
x |
DegE |
|
x |
x |
DegN |
|
x |
x |
DegE |
|
x |
x |
m |
|
x |
x |
m |
|
x |
x |
cm/s |
|
x |
x |
cm/s |
|
x |
|||
x |
x |
||
x |
x |
||
x |
x |
||
x |
x |
||
x |
x |
cm/s |
|
x |
x |
m |
|
x |
x |
||
x |
x |
||
x |
10-2K |
||
x |
Pa |
Defining product, parameters and time for the data request
Keep in mind that the time for one full orbit is around 90 minutes. The repeat cycle of the orbits is 7 days.
# Aeolus product
DATA_PRODUCT = "ALD_U_N_2B"

# measurement period in yyyy-mm-ddTHH:MM:SS
measurement_start = "2020-10-20T00:00:00Z"
measurement_stop = "2020-10-20T02:00:00Z"
Define Rayleigh parameter
# Product parameters to retrieve
# uncomment parameters of interest

# Rayleigh wind fields
parameter_rayleigh = [
    "wind_result_start_time",
    "wind_result_stop_time",
    "wind_result_COG_time",
    "wind_result_bottom_altitude",
    "wind_result_top_altitude",
    "wind_result_range_bin_number",
    "wind_result_start_latitude",
    "wind_result_start_longitude",
    "wind_result_stop_latitude",
    "wind_result_stop_longitude",
    "wind_result_COG_latitude",
    "wind_result_COG_longitude",
    "wind_result_HLOS_error",
    "wind_result_wind_velocity",
    "wind_result_observation_type",
    "wind_result_validity_flag",
    "wind_result_alt_of_DEM_intersection",
]
parameter_rayleigh = ["rayleigh_" + param for param in parameter_rayleigh]
Define Mie parameter
# Mie wind fields
parameter_mie = [
    "wind_result_start_time",
    "wind_result_stop_time",
    "wind_result_COG_time",
    "wind_result_bottom_altitude",
    "wind_result_top_altitude",
    "wind_result_range_bin_number",
    "wind_result_start_latitude",
    "wind_result_start_longitude",
    "wind_result_stop_latitude",
    "wind_result_stop_longitude",
    "wind_result_COG_latitude",
    "wind_result_COG_longitude",
    "wind_result_HLOS_error",
    "wind_result_wind_velocity",
    "wind_result_observation_type",
    "wind_result_validity_flag",
    "wind_result_alt_of_DEM_intersection",
]
parameter_mie = ["mie_" + param for param in parameter_mie]
Retrieve data from VRE server
# Data request for Rayleigh wind measurements
# check if parameter list is not empty
if len(parameter_rayleigh) > 0:

    request = AeolusRequest()

    request.set_collection(DATA_PRODUCT)

    # set wind fields
    request.set_fields(
        rayleigh_wind_fields=parameter_rayleigh,
    )

    # It is possible to apply a filter by different parameters of the product
    # Here, for example, a filter by geolocation is applied
    request.set_range_filter(parameter="rayleigh_wind_result_COG_latitude", minimum=0, maximum=90)
    request.set_range_filter(
        parameter="rayleigh_wind_result_COG_longitude", minimum=180, maximum=360
    )

    # set start and end time and request data
    data_rayleigh = request.get_between(
        start_time=measurement_start, end_time=measurement_stop, filetype="nc", asynchronous=True
    )

# Data request for Mie wind measurements
# check if parameter list is not empty
if len(parameter_mie) > 0:

    request = AeolusRequest()

    request.set_collection(DATA_PRODUCT)

    # set measurement fields
    request.set_fields(
        mie_wind_fields=parameter_mie,
    )

    # It is possible to apply a filter by different parameters of the product
    # Here, for example, a filter by geolocation is applied
    request.set_range_filter(parameter="mie_wind_result_COG_latitude", minimum=0, maximum=90)
    request.set_range_filter(parameter="mie_wind_result_COG_longitude", minimum=180, maximum=360)

    # set start and end time and request data
    data_mie = request.get_between(
        start_time=measurement_start, end_time=measurement_stop, filetype="nc", asynchronous=True
    )

# Save data as xarray data sets
# check if variable is assigned
if "data_rayleigh" in globals():
    ds_rayleigh = data_rayleigh.as_xarray()
if "data_mie" in globals():
    ds_mie = data_mie.as_xarray()
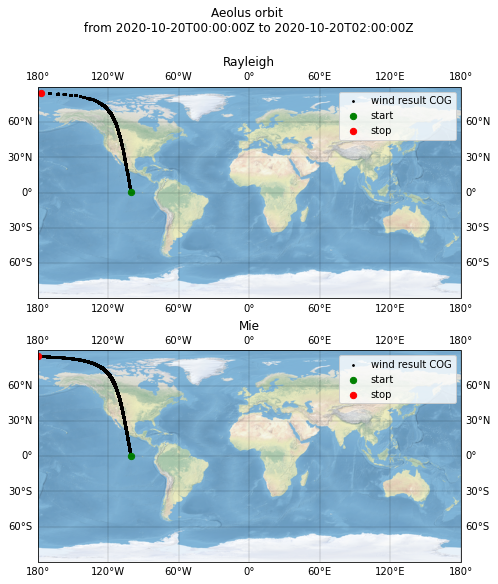
Plot overview map
Here all observation types (Rayleigh-clear, Rayleigh-cloudy, Mie-clear, Mie-cloudy) are plotted.
fig, ax = plt.subplots(
    2,
    1,
    figsize=(8, 8),
    subplot_kw={"projection": ccrs.PlateCarree()},
    constrained_layout=True,
)
for axis, ds, obs_type in zip(ax, [ds_rayleigh, ds_mie], ["rayleigh", "mie"]):
    axis.stock_img()
    gl = axis.gridlines(draw_labels=True, linewidth=0.3, color="black", alpha=0.5, linestyle="-")
    axis.scatter(
        ds[obs_type + "_wind_result_COG_longitude"],
        ds[obs_type + "_wind_result_COG_latitude"],
        marker="o",
        c="k",
        s=3,
        label='wind result COG',
        transform=ccrs.Geodetic(),
    )
    axis.scatter(
        ds[obs_type + "_wind_result_COG_longitude"][0],
        ds[obs_type + "_wind_result_COG_latitude"][0],
        marker="o",
        c="g",
        edgecolor="g",
        s=40,
        label="start",
        transform=ccrs.Geodetic(),
    )
    axis.scatter(
        ds[obs_type + "_wind_result_COG_longitude"][-1],
        ds[obs_type + "_wind_result_COG_latitude"][-1],
        marker="o",
        c="r",
        edgecolor="r",
        s=40,
        label="stop",
        transform=ccrs.Geodetic(),
    )
    axis.legend()
    axis.set_title(obs_type.title())
fig.suptitle("Aeolus orbit \n from {} to {} \n".format(measurement_start, measurement_stop))
Text(0.5, 0.98, 'Aeolus orbit \n from 2020-10-20T00:00:00Z to 2020-10-20T02:00:00Z \n')
Plot parameter
Curtain plot
Define 2D plot function for L2B point-like measurements
def plot_parameter_2D(
    parameter="wind_result_wind_velocity",
    channel="rayleigh",
    obs_type="clear",
    QC_filter=True,
    error_estimate_threshold=800,
    start_bin=0,
    end_bin=-1,
):

    if channel == "rayleigh":
        ds = ds_rayleigh
    elif channel == "mie":
        ds = ds_mie

    # define necessary parameters for plotting
    X0 = ds[channel + "_wind_result_start_time"].values
    X1 = ds[channel + "_wind_result_stop_time"].values

    Y0 = ds[channel + "_wind_result_bottom_altitude"].values / 1000.0
    Y1 = ds[channel + "_wind_result_top_altitude"].values / 1000.0
    Z = ds[channel + "_" + parameter].values

    # create a mask out of different filters which can be applied to the different parameters
    mask = np.zeros(len(Z), dtype=bool)

    # mask dependent on start and end bin given as parameter to the plot function
    mask[0:start_bin] = True
    mask[end_bin:-1] = True

    # mask where validity flag is 0
    if QC_filter:
        mask = mask | (ds[channel + "_wind_result_validity_flag"] == 0)

    # mask dependent on observation type
    if obs_type == "cloudy":
        mask = mask | (ds[channel + "_wind_result_observation_type"] != 1)
    elif obs_type == "clear":
        mask = mask | (ds[channel + "_wind_result_observation_type"] != 2)

    # mask where wind results have error estimates larger than a given threshold
    mask = mask | (ds[channel + "_wind_result_HLOS_error"] > error_estimate_threshold)

    # mask all necessary parameters for plotting
    # tilde before mask inverts the boolean mask array
    X0 = X0[~mask]
    X1 = X1[~mask]
    Y0 = Y0[~mask]
    Y1 = Y1[~mask]
    Z = Z[~mask]

    patches = []
    for x0, x1, y0, y1 in zip(X0, X1, Y0, Y1):
        patches.append(((x0, y0), (x0, y1), (x1, y1), (x1, y0)))

    # define min and max value for the colorbar
    if parameter == "wind_result_wind_velocity":
        Z_vmax = np.amax(np.abs(np.asarray([np.nanpercentile(Z, 2), np.nanpercentile(Z, 98)])))
        Z_vmin = -Z_vmax
    else:
        Z_vmax = np.nanpercentile(Z, 99)
        Z_vmin = np.nanpercentile(Z, 1)

    fig, ax = plt.subplots(1, 1, figsize=(10, 6), constrained_layout=True)
    coll = PolyCollection(
        patches,
        array=Z,
        cmap=cm.RdBu_r,
        norm=colors.Normalize(
            vmin=Z_vmin,
            vmax=Z_vmax,
            clip=False,
        ),
    )
    ax.add_collection(coll)

    ax.scatter(
        ds[channel + "_wind_result_COG_time"][~mask],
        ds[channel + "_wind_result_alt_of_DEM_intersection"][~mask] / 1000.0,
        marker='o',
        c='r',
        s=5,
        label='DEM altitude',
    )
    # ax.set_ylim(-1, 30)
    ax.set_xlabel("Date [UTC]")
    ax.set_ylabel("Altitude [km]")
    ax.set_title("{} - {} \n {} wind results".format(channel.title(), parameter, len(Z)))
    ax.grid()
    ax.legend()

    def format_date(x, pos=None):
        dt_obj = num2date(x, units="s since 2000-01-01", only_use_cftime_datetimes=False)
        return dt_obj.strftime("%H:%M:%S")

    ax.xaxis.set_major_formatter(format_date)
    ax.autoscale()
    fig.colorbar(coll, ax=ax, aspect=50, pad=0.01)
    fig.autofmt_xdate()
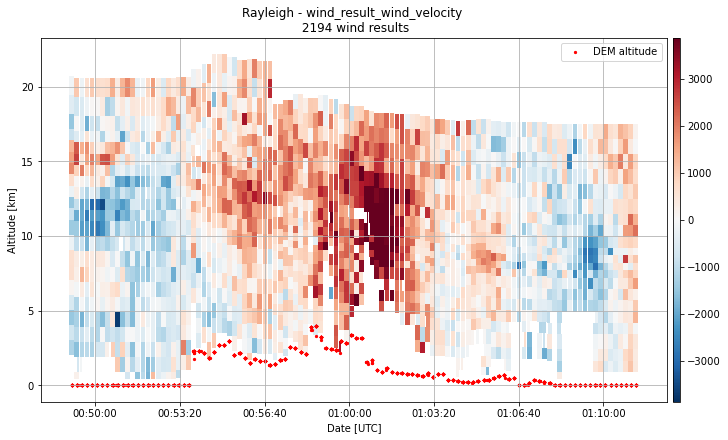
plot_parameter_2D(
    parameter="wind_result_wind_velocity",
    channel="rayleigh",
    obs_type="clear",
    QC_filter=True,
    error_estimate_threshold=800,
    start_bin=0,
    end_bin=-1,
)
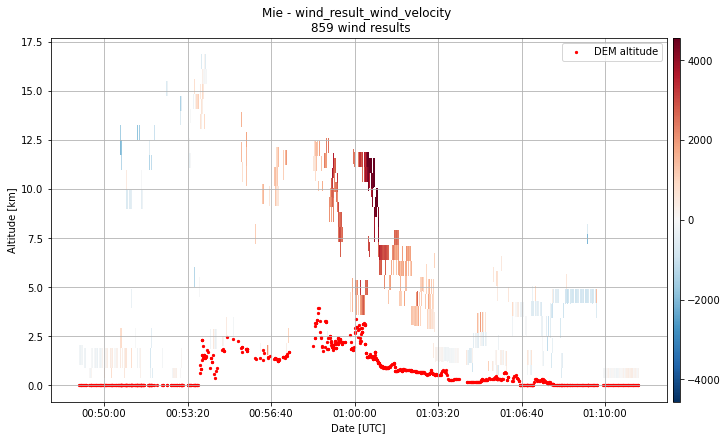
plot_parameter_2D(
    parameter="wind_result_wind_velocity",
    channel="mie",
    obs_type="cloudy",
    QC_filter=True,
    error_estimate_threshold=500,
    start_bin=0,
    end_bin=-1,
)