ALD_U_N_2C
Contents
ALD_U_N_2C
Abstract: Access to level 2c product
%load_ext watermark
%watermark -i -v -p viresclient,pandas,xarray,matplotlib
Python implementation: CPython
Python version       : 3.9.7
IPython version      : 8.0.1

viresclient: 0.11.0
pandas     : 1.4.1
xarray     : 0.21.1
matplotlib : 3.5.1
from viresclient import AeolusRequest
import datetime as dt
import matplotlib.pyplot as plt

request = AeolusRequest()
Product information
Description of product.
Documentation:
import matplotlib
from matplotlib.collections import PolyCollection
import matplotlib.pyplot as plt
import numpy as np
from datetime import datetime
plt.rcParams["figure.figsize"] = (25,8)
request.set_collection('ALD_U_N_2C')
request.set_fields(rayleigh_wind_fields=[
"rayleigh_wind_result_start_time",
"rayleigh_wind_result_stop_time",
"rayleigh_wind_result_bottom_altitude",
"rayleigh_wind_result_top_altitude",
"rayleigh_wind_result_wind_velocity",
])
data = request.get_between(
start_time="2020-04-15T06:21:58Z",
end_time="2020-04-15T07:50:33Z",
filetype="nc",
asynchronous=False
)
ds = data.as_xarray()
X0 = ds['rayleigh_wind_result_start_time'].values
X1 = ds['rayleigh_wind_result_stop_time'].values
Y0 = ds['rayleigh_wind_result_bottom_altitude'].values
Y1 = ds['rayleigh_wind_result_top_altitude'].values
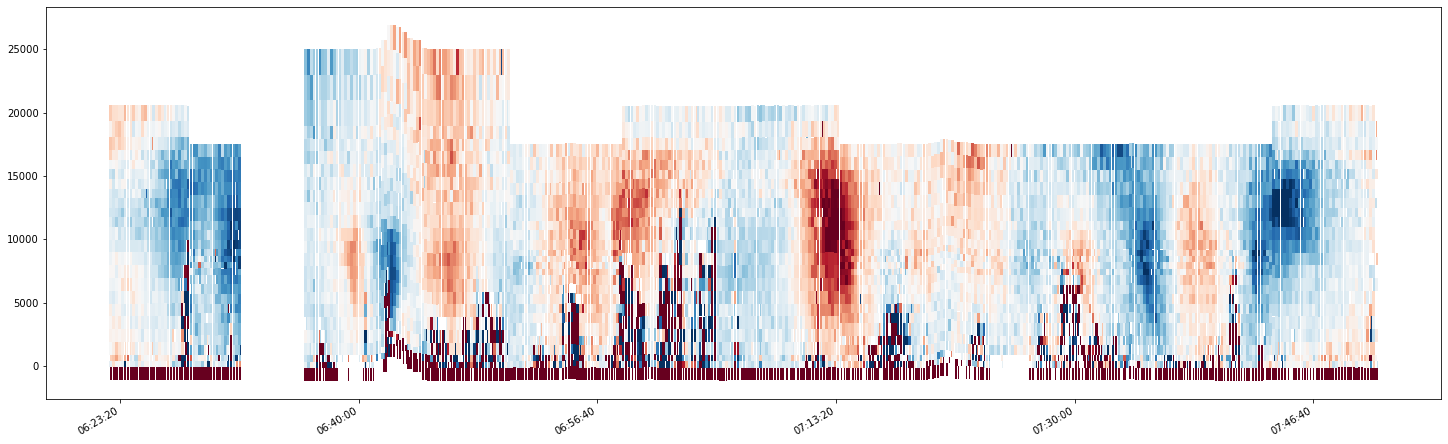
Z = ds['rayleigh_wind_result_wind_velocity'].values
patches = []
for x0, x1, y0, y1 in zip(X0, X1, Y0, Y1):
patches.append((
(x0, y0), (x0, y1), (x1, y1), (x1, y0)
))
fig, ax = plt.subplots()
coll = PolyCollection(
patches, array=Z, cmap=matplotlib.cm.RdBu_r,
norm=matplotlib.colors.Normalize(vmin=-6000, vmax=6000, clip=False),
)
ax.add_collection(coll)
epoch2000 = datetime(2000, 1, 1)
def format_date(x, pos=None):
dt_obj = datetime.fromtimestamp(int(x)+datetime.timestamp(epoch2000))
return dt_obj.strftime('%H:%M:%S')
ax.xaxis.set_major_formatter(format_date)
ax.autoscale()
fig.autofmt_xdate()
plt.show()